Shapefiles in R - making a basic map
I’ve been using R in my daily doings more and more and as a student in the geo-sciences making maps is pretty important. My first love is still GMT, but R is proving useful and this is just a brief note on how to make a very simple map using R and ggplot2.
Get the shapefile:
wget http://biogeo.ucdavis.edu/data/gadm2.8/shp/ZAF_adm_shp.zip
unzip ZAF_adm_shp.zip
Install these packages (I’m lazy, so I just use the wildcard)
sudo apt install r-base-core libgdal\* libproj\* libgeos\* Open R and first do:
install.packages(
c("ggplot2", "rgdal","rgeos","maps","sp")
)
The needed packages should be installed. Load the libraries and read the shapefiles. In this case ZAF_adm1 is South-Africa’s provincial demarcations.
library(ggplot2)
library(rgdal)
library(rgeos)
theme_set(theme_classic(base_size=22))
#Define the basemap as basemap, where dsn == the directory where the shapefile
#is located
basemap <- map_data(readOGR(dsn="southafrica", layer="ZAF_adm1"))
#We can get some stats on the basemap to set our boundaries
#summary(basemap)
# long lat group order
# Min. :16.45 Min. :-34.84 Min. : 1.00 Min. : 1
# 1st Qu.:20.82 1st Qu.:-31.34 1st Qu.:10.00 1st Qu.: 90332
# Median :27.00 Median :-29.93 Median :18.00 Median :180662
# Mean :25.51 Mean :-29.54 Mean :23.19 Mean :180667
# 3rd Qu.:29.48 3rd Qu.:-27.31 3rd Qu.:29.00 3rd Qu.:270994
# Max. :32.89 Max. :-22.13 Max. :55.00 Max. :361342
# region subregion
# Length:361288 Length:361288
# Class :character Class :character
# Mode :character Mode :character
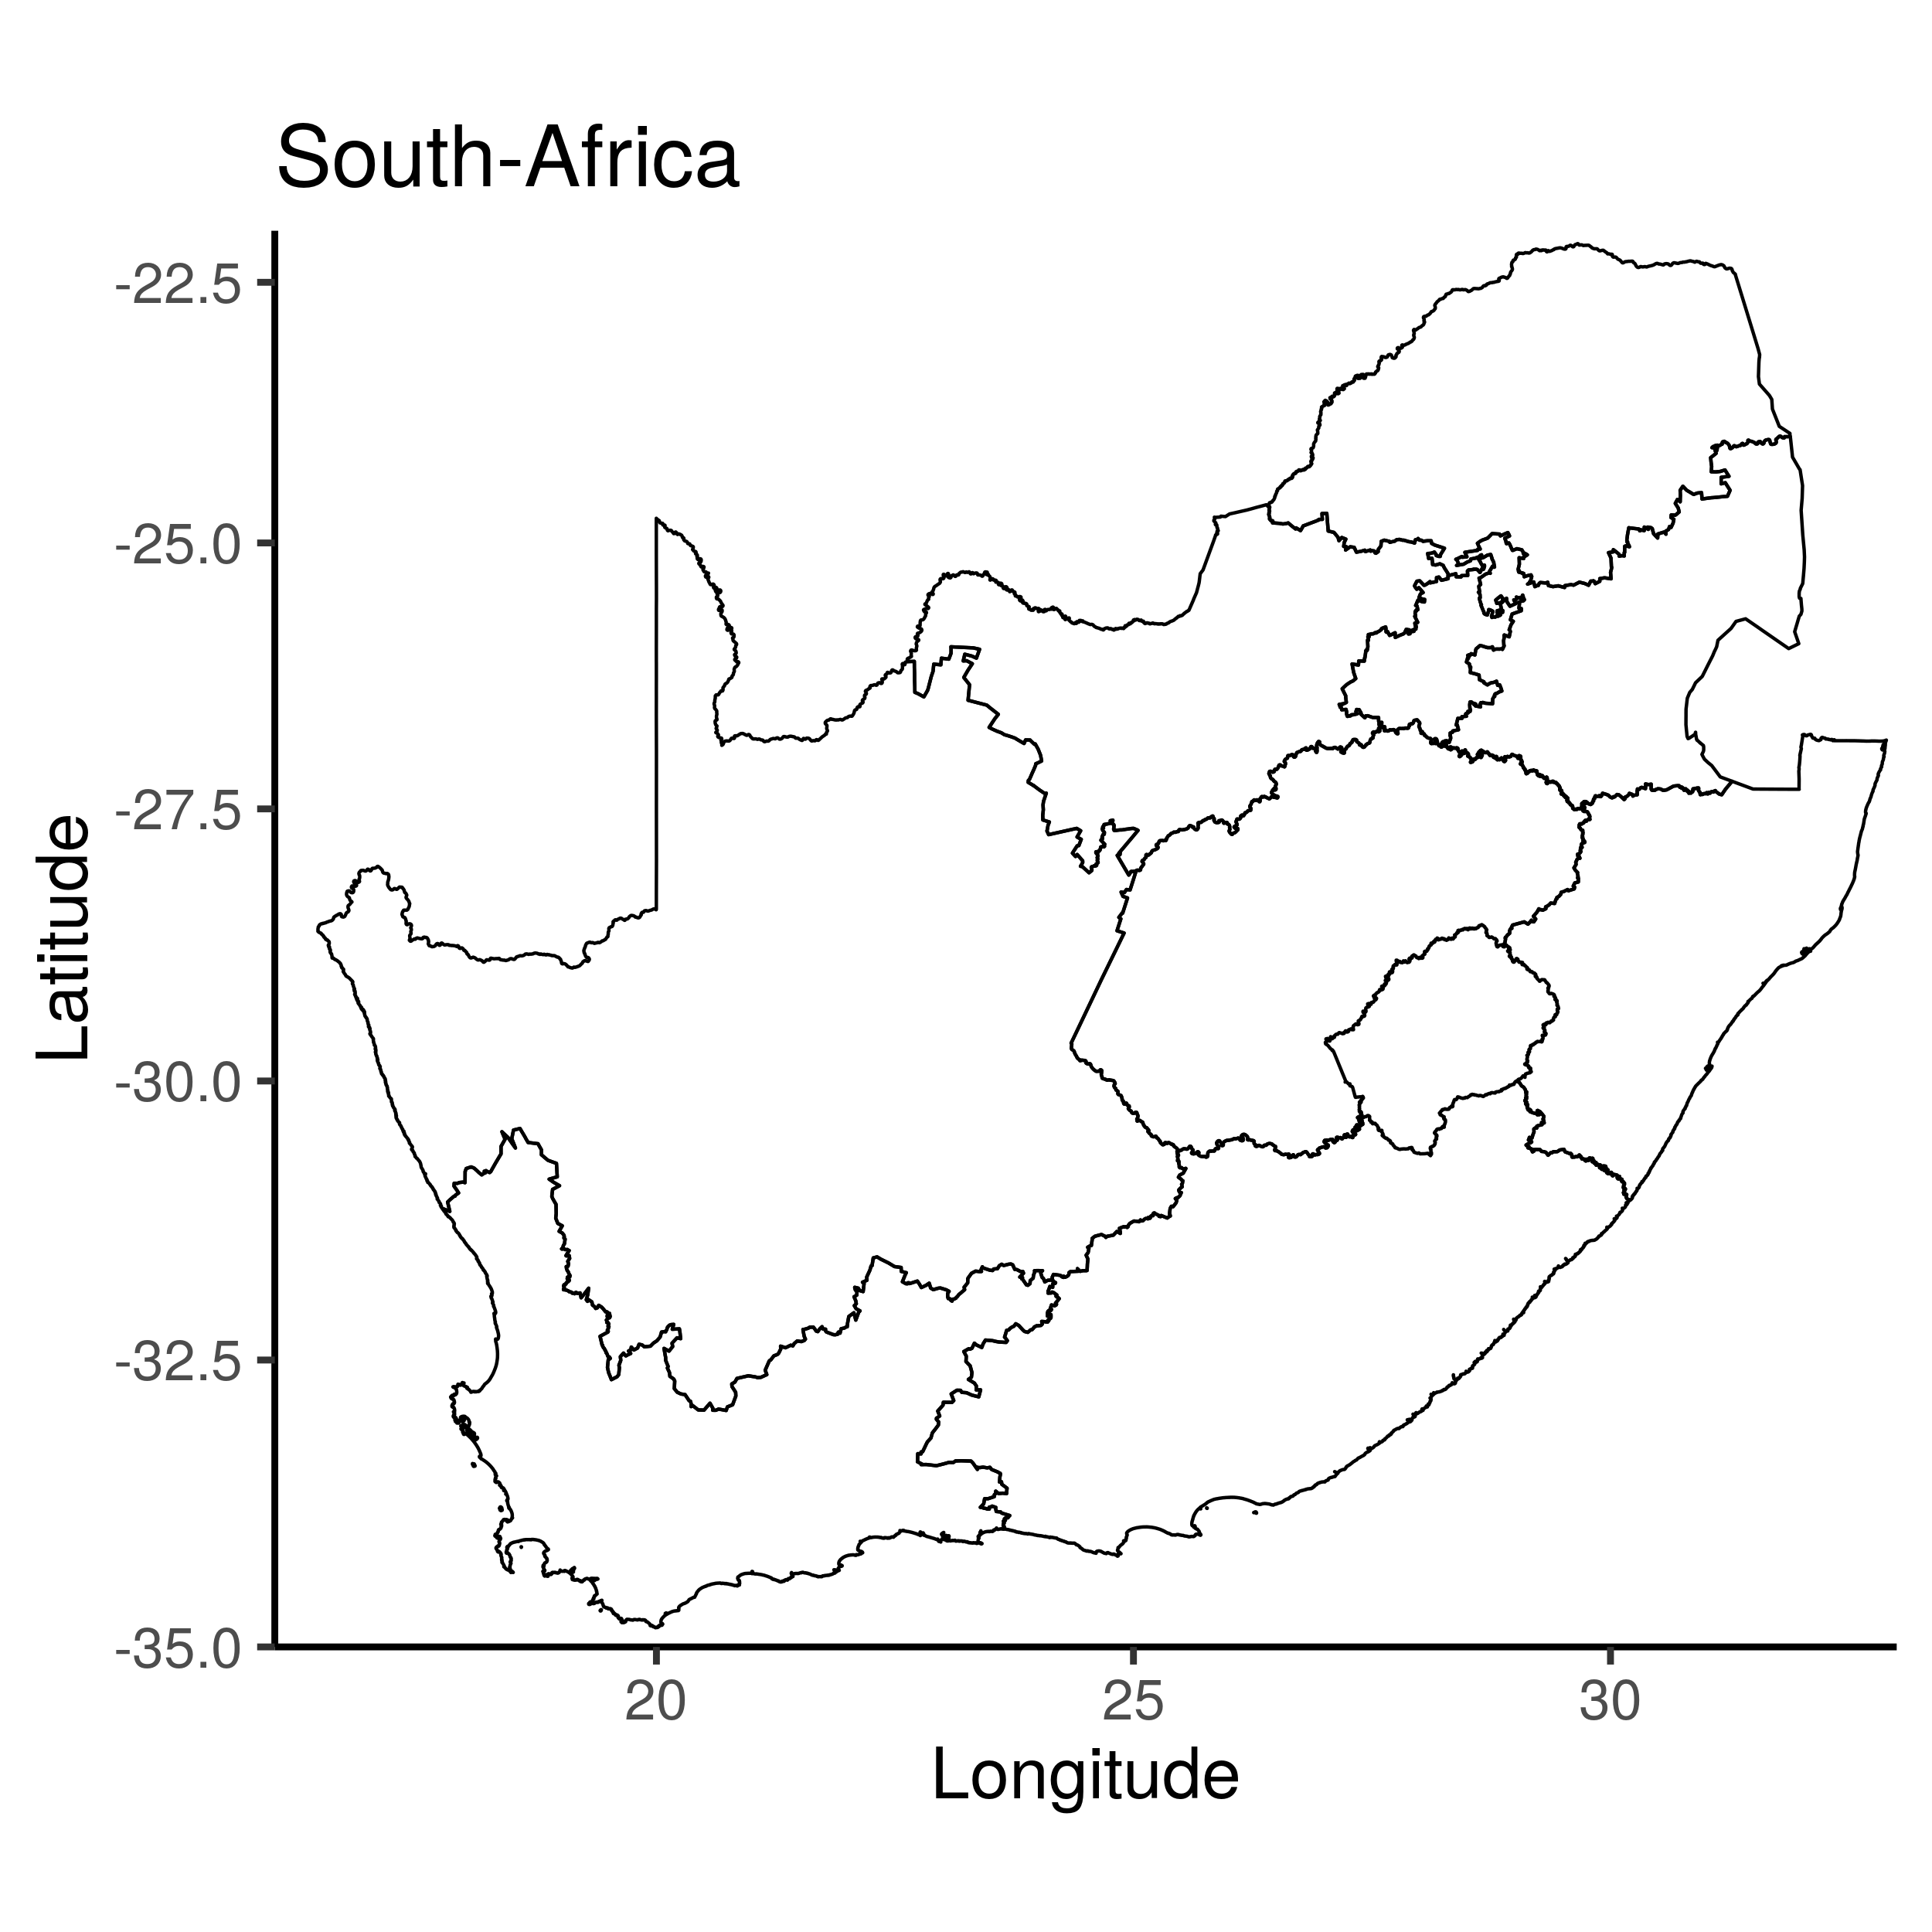
plt <- ggplot() +
geom_path(data=basemap, aes(x=long, y=lat, group=group)) +
coord_map(ylim=c(-22,-35), xlim=c(16, 33)) +
ggtitle("South-Africa") +
ylab("Latitude") + xlab("Longitude")
#To see the map
plt
#To save the map
png("SA_Map", width = 5 * 500, height = 5 * 500, res = 300)
plt
dev.off()And tada, a map of South-Africa
To add points in the map you can do
plt <- plt +
annotate("text", x = 28.3, y=-25.5, label = "PTA") +
annotate("point", x = 28.2293, y=-25.7479, colour = "red", size = 2.5)
or if you have a file with a ton of lat/lon points
#Assuming they are in a csv file (NAME,LAT,LON)
df <- read.csv("cities.csv", sep=",", header=TRUE)

plt <- ggplot() +
geom_path(data=basemap, aes(x=long, y=lat, group=group)) +
geom_point(data=df, aes(x=LON, y=LAT)) +
coord_map(ylim=c(-22,-35), xlim=c(16, 33)) +
ggtitle("South-Africa") +
ylab("Latitude") + xlab("Longitude")